The notebook below is a continuation of a previous blogpost where I started loading F1 Data into Snowflake ❄️ using the Ergast API. Next up is plotting this data on a map using Folium. Folium is a Python library used for visualizing Geospatial Data. *”It builds on the data wrangling strengths of the Python ecosystem and the mapping strengths of the Leaflet.js library. Manipulate your data in Python, then visualize it in a Leaflet map via folium.”*
Follow the steps below to get things started.
- I use an Anaconda environment from where I have started Jupyter Lab.
- Next install all the necessary library’s
- Import necessary library’s
- Create a function to get a Continent based on the Country and
- Create a function to define the marker color based on the Continent
- Setting up a Snowflake connection
- After setting the connection to Snowflake it’s time to connect to the database, verify the connection and get the data out of the Circuits-table
- Convert the Data output to a Pandas Data Frame so we can plot this Data on a Folium Map
- Create the Folium Map. In this example 3 different variants:
- World Map
- Continent Map (Europe)
- Country Map (France)
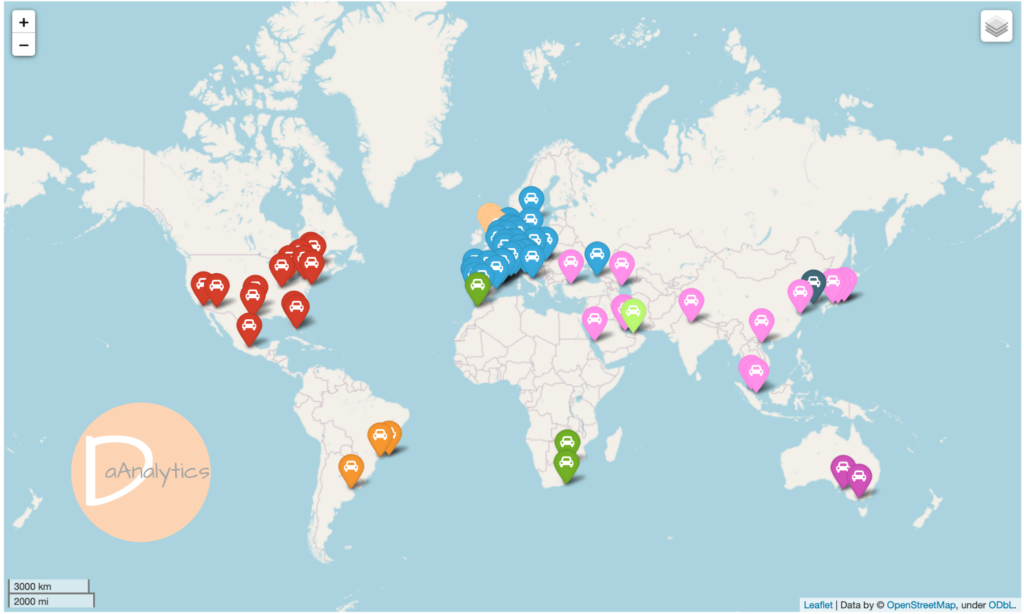
The above notebook results in the below maps.
World Map
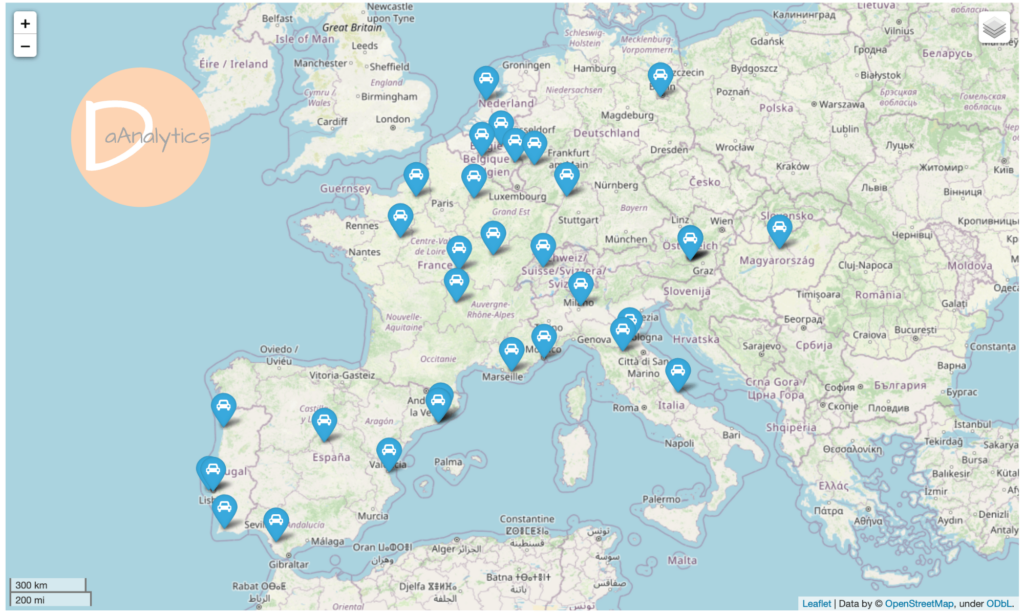
Continent Map (Europe)
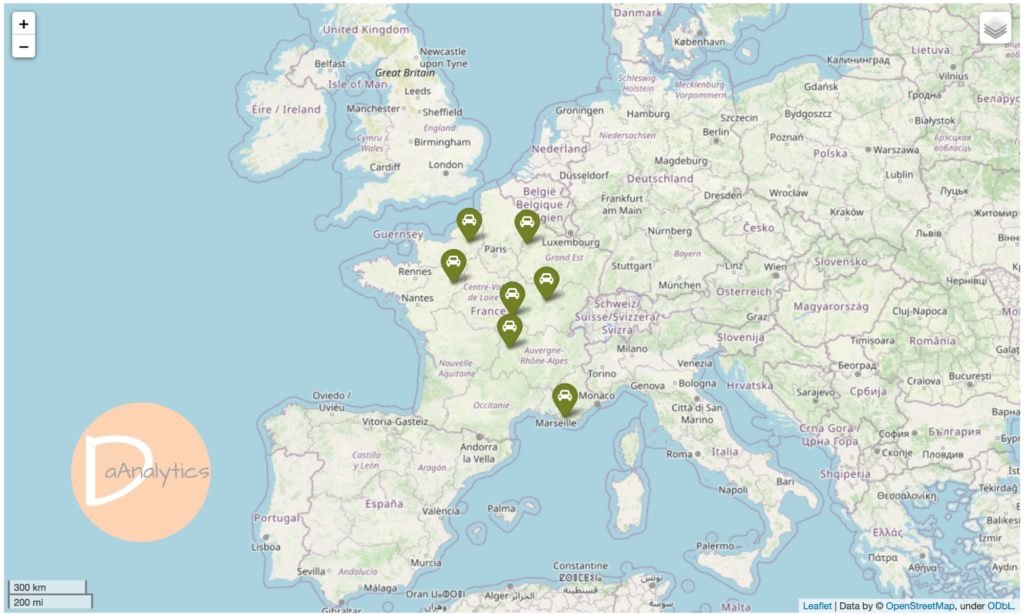
Country Map (France)
Closing Statements
This example provided the steps to plot F1 Circuit Locations into a map using Folium; a Python library used for visualizing Geospatial Data. Please check it out and let me know what you think. The code is on Github. In a next example I will covert this code into a Streamlit Application.
Till next time.