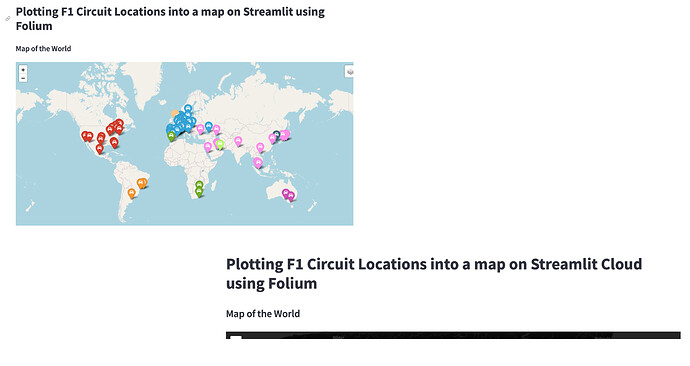
In my last blogpost I showed how to plot F1 Circuit Locations into a map using Folium on Streamlit. The idea is to switch between the World, a possible Continent and a possible Country. Check the video below.
Streamlit Cloud
Next step would be setting things up in Streamlit Cloud. At time of writing my previous blogpost I ran into issues, which I was able to solve with the help of some experts on the forum.
Following the steps from the Streamlit documentation makes setting things up relatively straightforward.
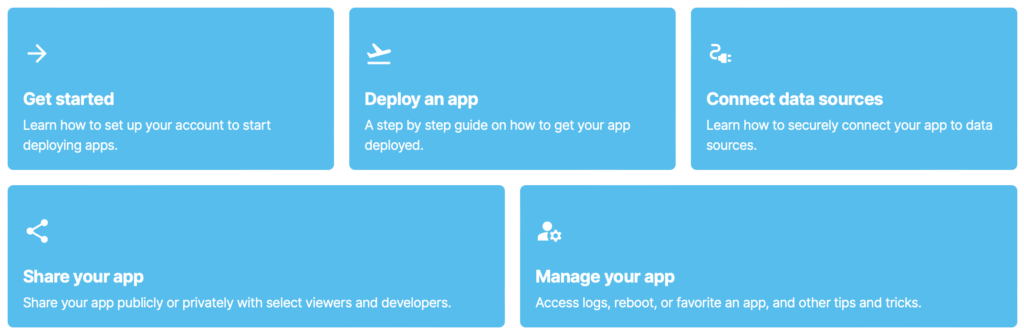
Get started
First we have to create an account (or login to an existing account). Get started or log in. I connected my Github-account with Streamlit Cloud. This way I can upload my apps to Github. Changes to an app in Github are automatically reflected in Streamlit Cloud.
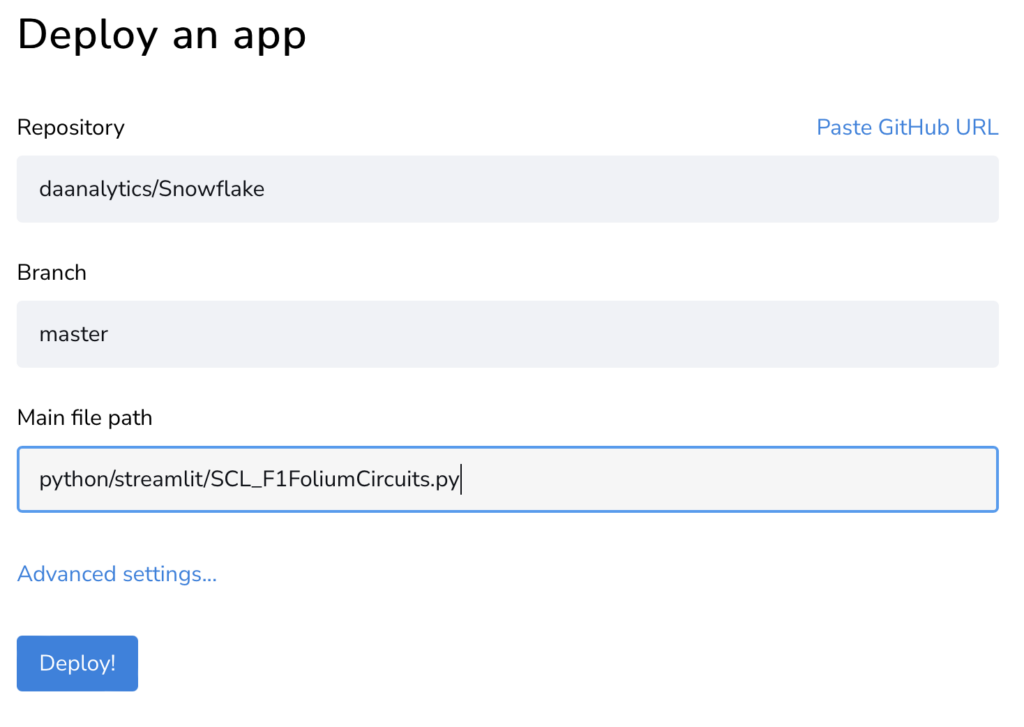
Deploy an app
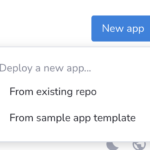
Deploying an app is almost as easy as pointing to the right code on Github.
The connection to Snowflake from Streamlit Cloud are a little bit different. The connection details are in the Streamlit Cloud ‘Advanced settings’.
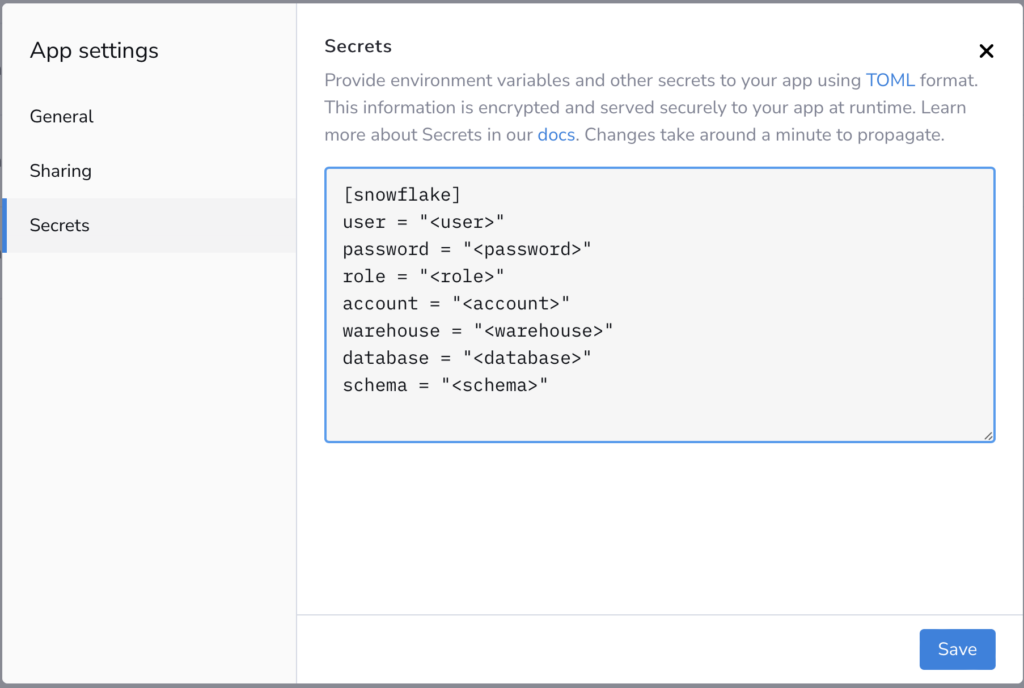
I slightly changed the code compared to my last blogpost. In the Python code the connection details are called as followed:
Special attention to the requirements.txt-file. Make sure you have the right (and in my case the latest) versions of the libraries you use in your code. I had a problem with my first version of the app because of a wrong version of the streamlit-folium library. Thanks to the experts on the forum. I was able to solve the problem and make the app work in the Streamlit Cloud.
Closing Statements
In the previous example(s) I provided the steps to plot F1 Circuit Locations into a map using Folium; a Python library used for visualizing Geospatial Data.
In the first example it was a very static version where I plotted the F1 Circuit Locations either for the World, Europe or France. These options were hardcoded in the notebook and showed after each other.
In the second example I added some interactivity with Streamlit. The idea was to switch between the World, a possible Continent and a possible Country based on selected radio buttons in the sidebar.
The third example shows the same setup but then from the Streamlit Cloud. The code is on GitHub.
Till next time.